david dominguez 😺
Sentinel - Common Log Onboarding Methods
Apr 15, 2026Recap: What are logs?
Bringing this excerpt from the original intro post, outlining and answering the question of what exactly are logs?
This brings understanding of the importance around logs, and tells half of the story as to why they are valuable for investigations.
Logs are records of events generated by a system or application. In an enterprise SIEM environment, logs are an output from specific security appliances/devices. They have a very tight scope as to what they are looking at (e.g. All network traffic, authentication logs, EDR logs, etc.)
- Take firewall logs for example. These are the core attributes of what we’d see. Usually when analysts are looking at it, they’re validating over the traffic and seeing what exactly has been going on that caused an alert to trigger.
| Timestamp | Source IP | Dest IP | Source Port | Dest Port | Protocol | Rule Name | Action | Traffic Type | Severity |
|---|---|---|---|---|---|---|---|---|---|
| 2024-03-14 08:15:23 | 192.168.1.105 | 203.0.113.45 | 54321 | 443 | TCP | Allow_HTTPS_Internal | ALLOWED | Internal to External | Low |
| 2024-03-14 08:18:47 | 10.0.2.50 | 192.168.1.1 | 53421 | 22 | TCP | Block_SSH_External | BLOCKED | External to Internal | High |
| 2024-03-14 08:22:10 | 192.168.1.200 | 8.8.8.8 | 52341 | 53 | UDP | Allow_DNS | ALLOWED | Internal to External | Low |
| 2024-03-14 08:25:33 | 203.0.113.99 | 192.168.1.50 | 45123 | 445 | TCP | Block_SMB_External | BLOCKED | External to Internal | Critical |
| 2024-03-14 08:29:56 | 10.0.1.25 | 172.16.0.10 | 55234 | 3306 | TCP | Allow_Database_Internal | ALLOWED | Internal to Internal | Low |
Recap: What is a SIEM?
Also bringing this excerpt form the original intro post as well, which outlines and answers what exactly a Security Information Evenet Management solution is.
This brings understanding of the importance around what exactly the platform we’re working on is.
A SIEM solution, put simply, collects all the security-relevant logs within a large enterprise, and puts it all into a centralized location, for future detection and analysis. I’ve provided an ASCII visual below to demonstrate how the flow usually looks like.
┌──────────────────────────┐      ┌────────────────────────────┐      ┌──────────────────────────┐
│   LOG SOURCES            │      │   SIEM                     │      │   USERS                  │
├──────────────────────────┤      ├────────────────────────────┤      ├──────────────────────────┤
│                          │      │                            │      │                          │
│  🖥️  Firewalls           │      │  ┌──────────────────────┐  │      │  👤 Security Analysts    │
│  🖥️  Servers             │      │  │ Log Ingestion        │  │      │  👤 SOC Engineers        │
│  🖥️  Endpoints           │      │  └──────────────────────┘  │      │  👤 DevOps Teams         │
│  🖥️  Network Devices     │ ---> │           ↓                │ <--- │  👤 Security Managers    │
│  🖥️  Cloud Services      │      │  ┌──────────────────────┐  │      │                          │
│  🖥️  Web Applications    │      │  │ Correlation &        │  │      │  Activities:             │
│  🖥️  Databases           │      │  │ Enrichment           │  │      │  • Investigate alerts    │
│  🖥️  Active Directory    │      │  └──────────────────────┘  │      │  • Analyze threats       │
│  🖥️  IDS/IPS Systems     │      │           ↓                │      │  • Configure rules       │
│  🖥️  Proxy/WAF           │      │  ┌──────────────────────┐  │      │  • Tune SIEM             │
│  🖥️  DNS Servers         │      │  │ Alerting &           │  │      │  • Review dashboards     │
│      ...                 │      │  │ Dashboarding         │  │      │  • Create reports        │
│                          │      │  └──────────────────────┘  │      │                          │
│                          │      │           ↓                │      │                          │
│                          │      │  ┌──────────────────────┐  │      │                          │
│                          │      │  │ Data Storage &       │  │      │                          │
│                          │      │  │ Retention            │  │      │                          │
│                          │      │  └──────────────────────┘  │      │                          │
└──────────────────────────┘      └────────────────────────────┘      └──────────────────────────┘
- On the left you have a bunch of log sources, and the log source information is passed to the SIEM.
- The SIEM ingests all the log information (ingestion is the process of moving log data into the SIEM), and then the logs are actioned upon in some way (e.g. used to enrich existing alerts, directly used to create alerts and correlate with other sources, used for dashboards, etc.)
- The users of the SIEM are typially security-minded employees who step into the SIEM when they need to perform activities such as investigating alerts (Security Analysts), configuring detection rules and making tuning changes to the SIEM (SOC Engineers), etc.
The Two Ways of Onboarding
We have two primary different ways of onboarding to Sentinel. These are going to cover most log sources, but of course there are always exceptions. Refer to vendor/application specific documentation for reference. There are other methods of course (Log Ingestion API, CCF, etc.) but for the purposes of initial understanding, this will suffice and give us a strong starting point. Below is a high level understanding for each type of method:
- Out of the Box via Content Hub & Data Connectors
- This is the easiest method out of all of them
- Usually cloud-based solutions are supported via this method.
- Lowest maintenance since you as an individual don’t have to manage the connector since it is pre-built for you, mostly just need to grab some API key or similar setup.
- The main downside is that this doesn’t support ALL possible log sources, but it covers a fair amount.
- Syslog
- This is kind of a ‘catch-all’ bucket for any other log sources that don’t have native connectors.
- Usually this is for appliances that have external internet connectivity but no clear connector to install from the Content Hub
- Requires higher level of maintenance since this method requires the use of a Syslog server
- The main upside is that this can support almost any type of log source, but obviously it’s not always the best design. Want to use this only when needed since you inherently incur maintenance and infrastructure cost.
Method 1: Out of the Box via Content Hub & Data Connectors
So with Sentinel there’s two main sections, Content Hub and Data Connectors.
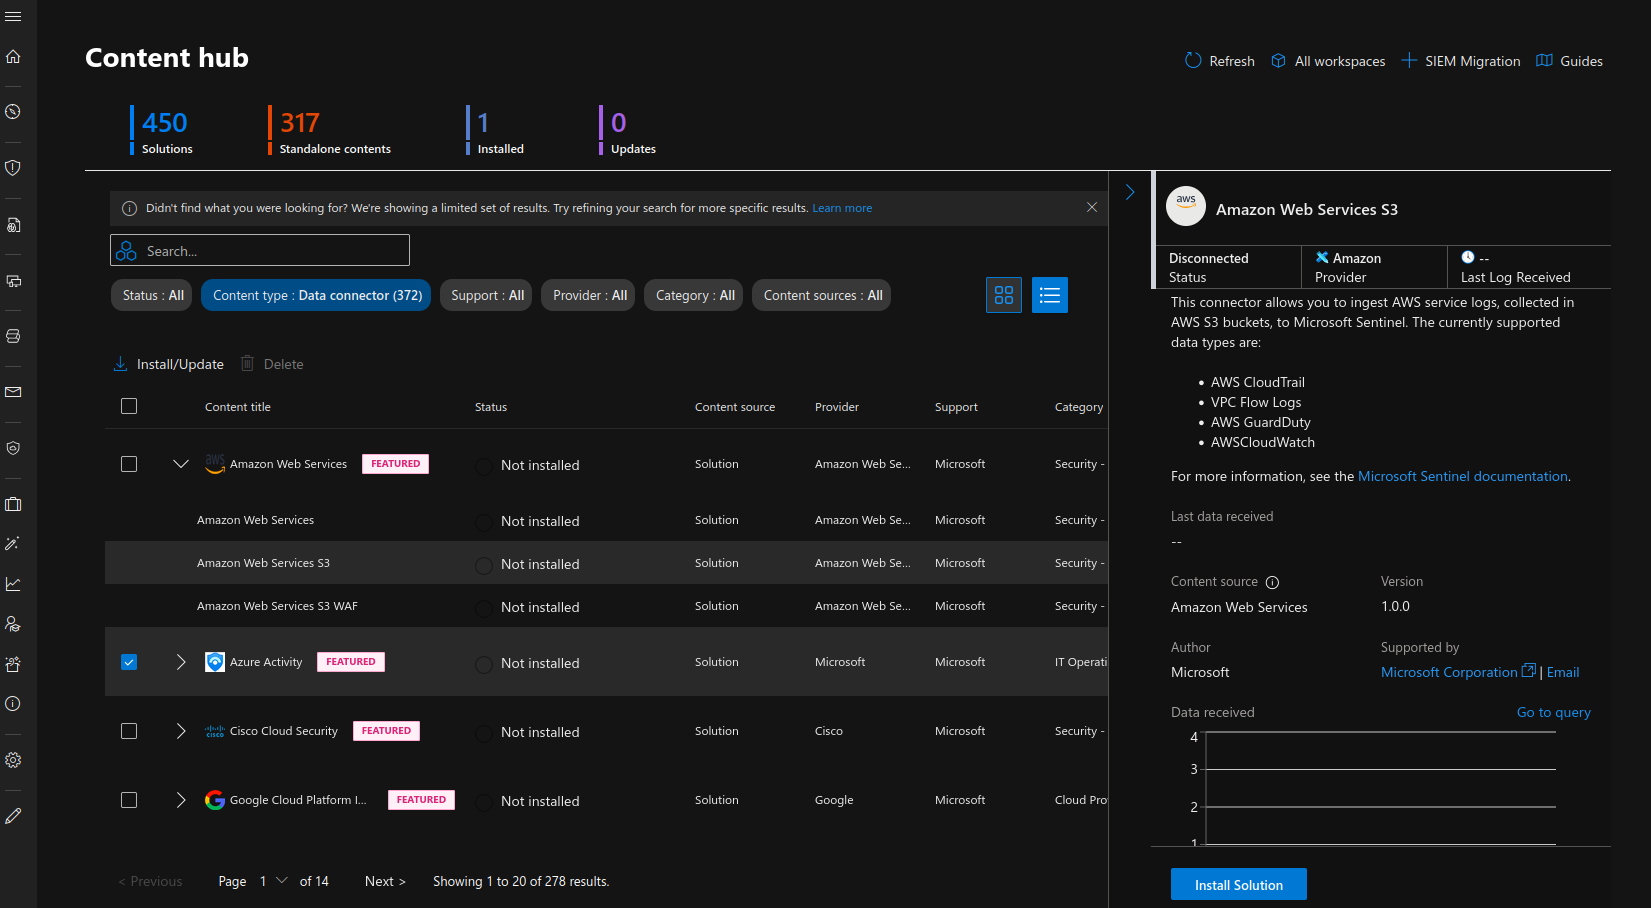
Content Hub, when it comes to log onboarding, is what allows you to install specific out of the box data connectors to the Sentinel. You go through and decide what data connector you need, and install it to your environment.
Below is a screenshot of how this looks like (Microsoft have moved this area to the Defender area, hence why you’ll see the theme change. In Sentinel you can still see the Content Hub, but it just redirects you to here).
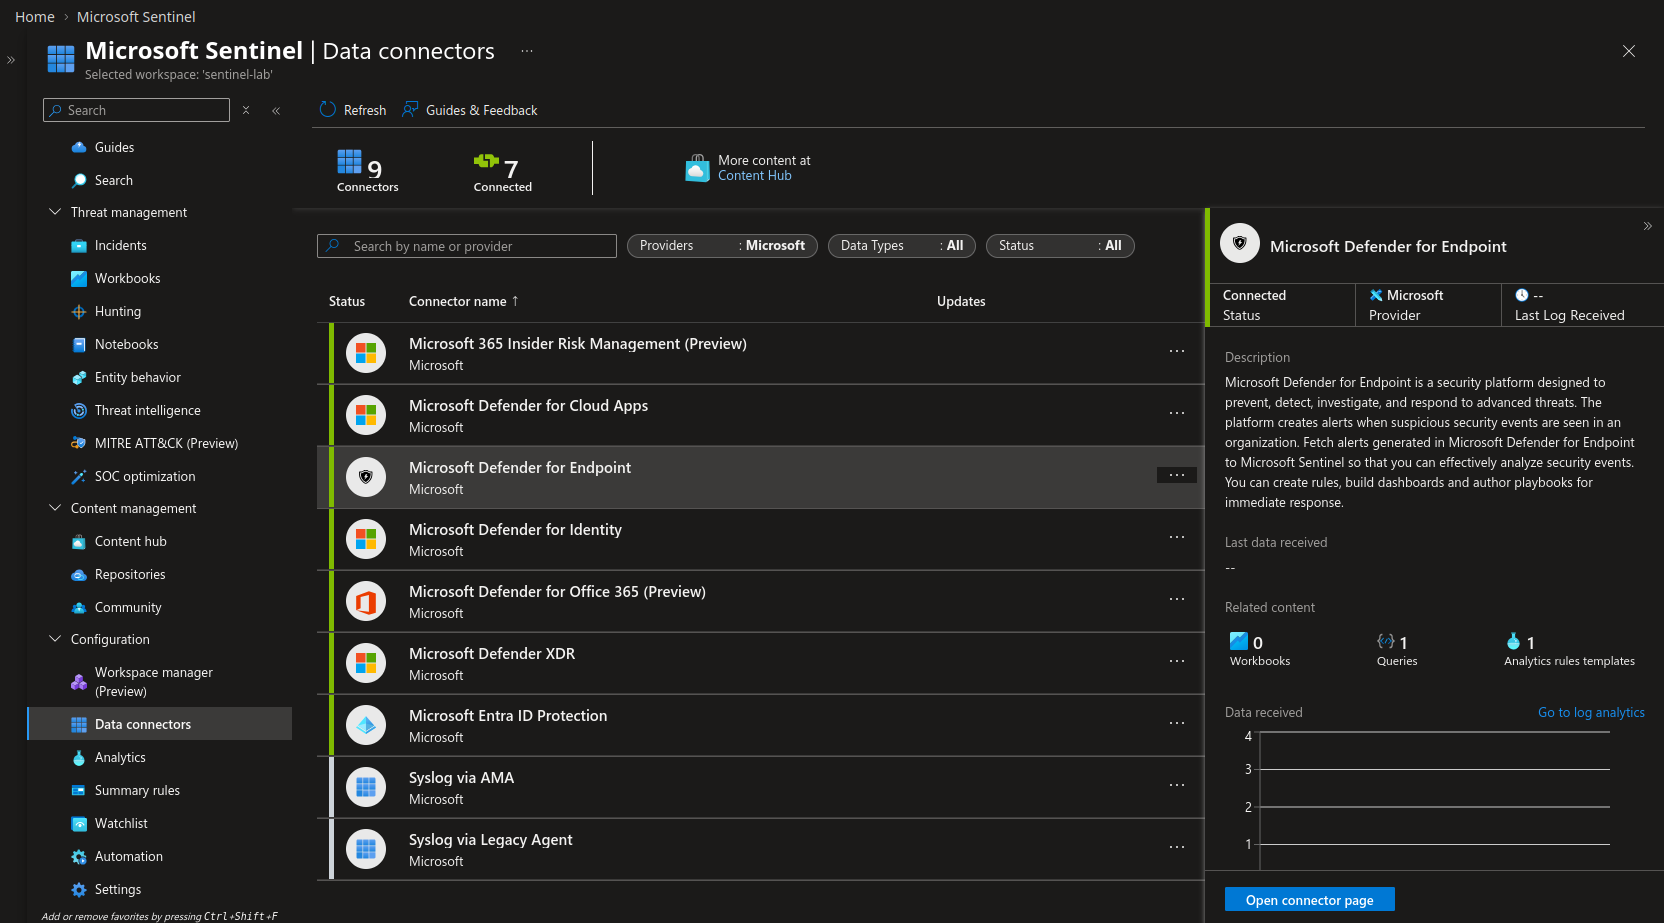
Next, Data Connectors is what allows you to configure the newly installed connector so that you can connect your log source to Sentinel.
From the Data Connectors area, you can configure the log source so that you can connect it to your instance.
Below shows the initial page of the Data Connectors area.
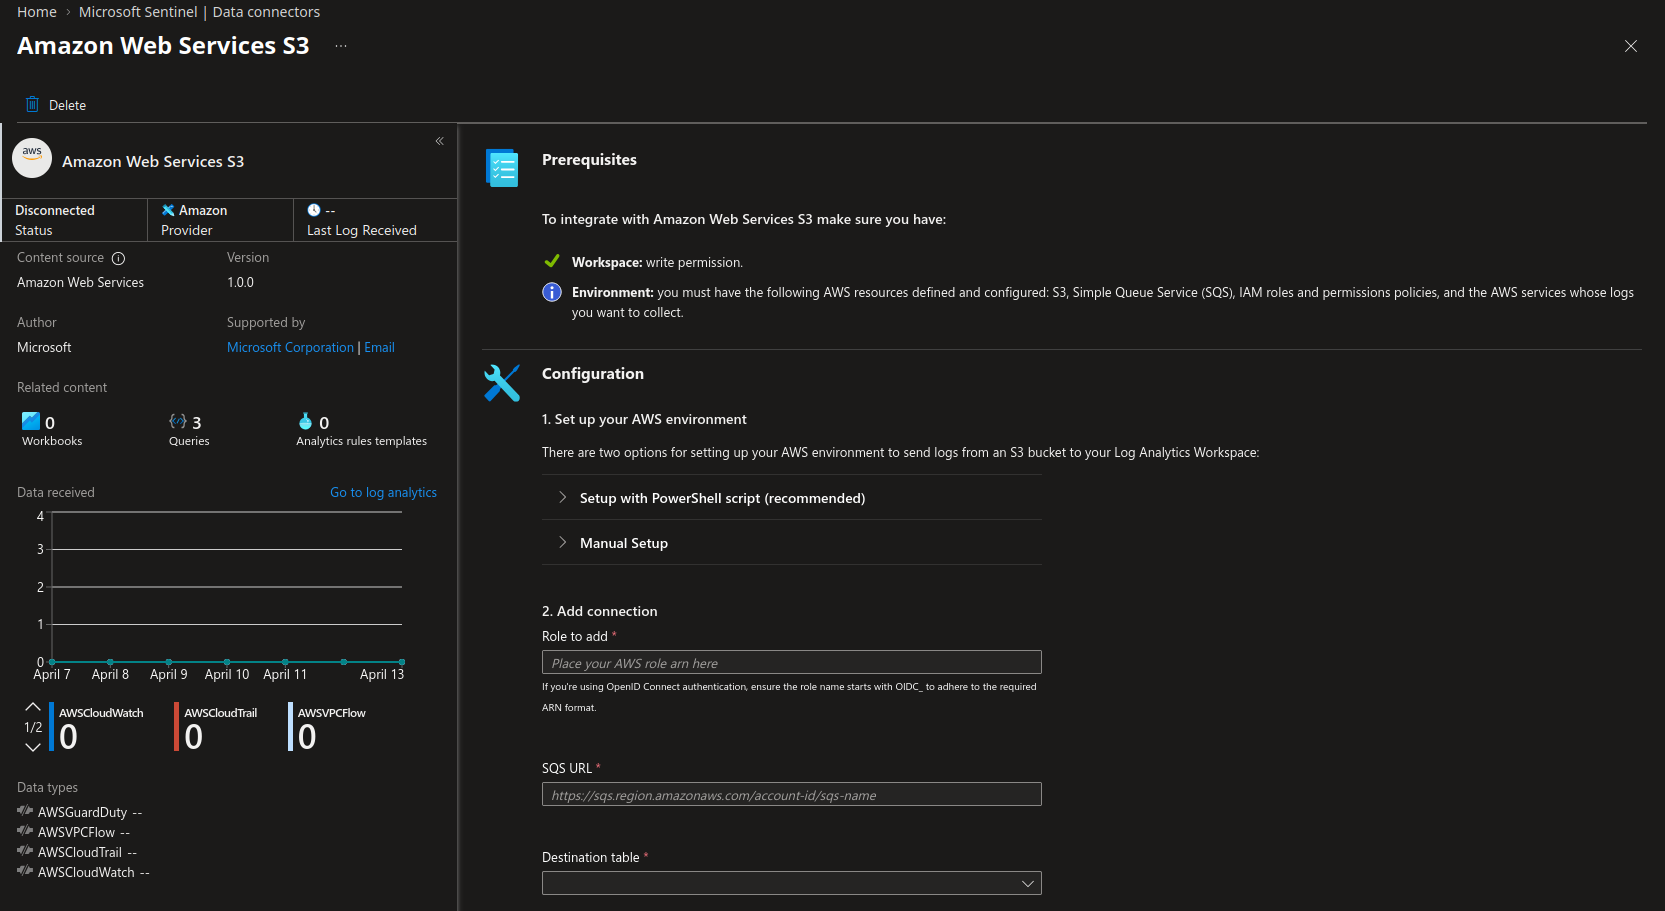
And then below shows the next area where you can specifically make configuration changes for a connector so that you can proceed with onboarding
An analogy that might help you to understand a little bit better would be something like:
- Imagine you have a Lego project you’re working on, and you have two separate chunks of pieces, imagine two halves of a Lego ship.
- You need one piece that connects the two halves to complete your project.
- You go to the store to look for the piece, and you try to find the correct piece to finish your project. (You can imagine this is the same as going onto Content Hub and searching for the right connector from Content Hub.)
- After you find the right piece, you bring it home and test it, and it works! (You can imagine this being the Data Connectors portion of it)
Troubleshooting tips:
- Double check you have the right API key
- Double check the access your key has
- Validate your endpoint/configuration is indeed the expected one
- Validate the way you have setup your environment to prepare for the OOB connectors (e.g. AWS environment, etc.)
Method #2: Syslog
‘Syslog is a standardized message logging protocol supported by numerous operating systems, applications, and hardware devices for transmitting data’ (CrowdStrike).
In other words, we use this protocol to send messages between computers and is widely adopted and supported by a variety of devices, making it optimal for sending information between computers (or in our case, logs).
Now, without getting too into the details as to what Syslog is, let’s just talk functionally what we use it for when we’re talking about log onboarding:
Syslog messages are essentially messages that one system generates, and then the Syslog protocol is used to send these messages to another machine. Syslog uses port 514 to send its messages across to other machines. A Syslog server is essentially the central connector between our SIEM (Sentinel, in this case), and these machines that are sending Syslog messages. So, the machines will create messages, send it over 514 to the Syslog server, and then the Syslog server will forward these logs along to Sentinel, ideally via Azure Monitor Agent (AMA).
┌─────────────────┐              ┌─────────────────┐
│   Linux Host A  │              │   Linux Host B  │
└────────┬────────┘              └────────┬────────┘
         │                                │
         │  UDP/TCP 514                   │  UDP/TCP 514
         │                                │
         └───────────────┬────────────────┘
                         │
                         ▼
              ┌──────────────────────┐
              │    Syslog Server     │
              │      (Linux VM)      │
              └──────────┬───────────┘
                         │
                         │  HTTPS / Port 443
                         │
                         ▼
              ┌──────────────────────┐
              │  Microsoft Sentinel  │
              │  (Log Analytics      │
              │     Workspace)       │
              └──────────────────────┘
The visual above supports my previous paragraph, but let me hone in a bit more:
- Linux Host A and B both generate their own messages and send it to the Syslog Server via Syslog (port 514)
- The Syslog Server (typically a Linux VM) then sends the information to Sentinel via 443 since we’re using AMA
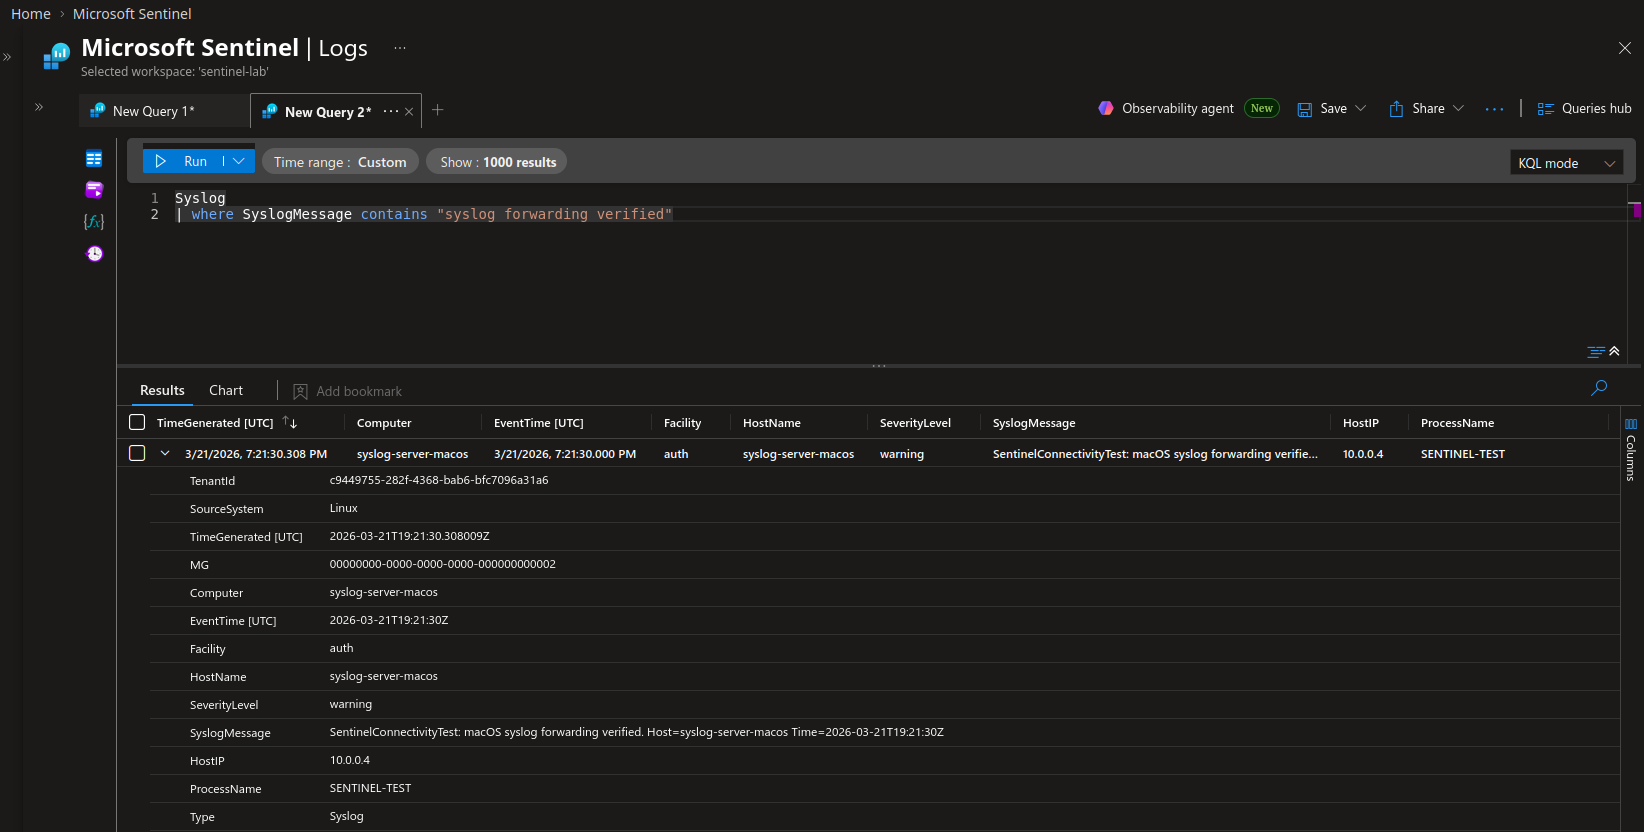
- Sentinel receives it and then processes it for ready usage by Sentinel users (Open below image in new tab to read better)
Things to keep in mind:
- Syslog message storage can add up over time, hence the extra maintenance to keep the VM lean, to keep the cost low.
- Unlike out of the box methods, Syslog is not parsed automatically, and most of your juicy information will come in via this ‘SyslogMessage’ field. You’ll need to make adjustements and parse the logs to gain good ability to query it later down the line.
- Generally, the more we can use out of the box connectors for, the better. Syslog is not ideal since we will need to maintain infrastructure and the parsing for the future.
- The Syslog connection via AMA is handled by Sentinel, there is an out of the box script that you need to run on the Syslog server to establish that connection.
Troubleshooting tips:
- Test each major connection/inflection point (i.e. Host A -> Server, then Server -> Sentinel). You can send logs yourself via Syslog to support this.
- Check your AMA health
- Check your inbound network rules on the Syslog Server
References
CrowdStrike: https://www.crowdstrike.com/en-us/guides/syslog-logging/